
Animating Stock Markets
A strategy with a Sharpe Ratio of 2.94
The paper "Animating Stock Markets" explores an innovative approach to predicting stock price trends using Variational Recurrent Neural Networks (VRNNs). By converting daily price changes into graphical representations and training the model on these visuals, the authors aim to forecast future price trajectories. The data comes from S&P500 index constituents from 1993 to 2021, and the model shows exceptional performance, especially with larger, less predictable stocks. This method opens new possibilities for portfolio construction, emphasizing the importance of liquidity.
Five Key Takeaways:
- Innovative Prediction Method: Uses VRNNs to transform stock price changes into graphics, offering a novel way to forecast stock price movements.
- Superior Performance: Demonstrates enhanced predictability for larger, less predictable stocks, suggesting a new avenue for high-liquidity portfolio construction.
- Data-Driven Approach: Employs data from the S&P500 index constituents over a significant period (1993-2021), ensuring a robust and comprehensive analysis.
- Complexity and Limitations: While computationally intensive and possibly specific to the data set's market conditions, the study highlights advanced machine learning's potential in finance.
- Future Implications: Suggests promising research directions in finance by integrating advanced computational methods, offering a new toolkit for understanding market dynamics.
The paper specifically highlights a table that compares the performance of portfolios based on different strategies, including the proposed VRNN model, momentum, short-term reversal, and long-term reversal. This table (referred to as Table 3 in the document) presents annual returns, annualized standard deviation, maximum drawdown, Sharpe ratio, and Calmar ratio for value-weighted and equal-weighted portfolios across different strategies.
Variational Recurrent Neural Network (VRNN)
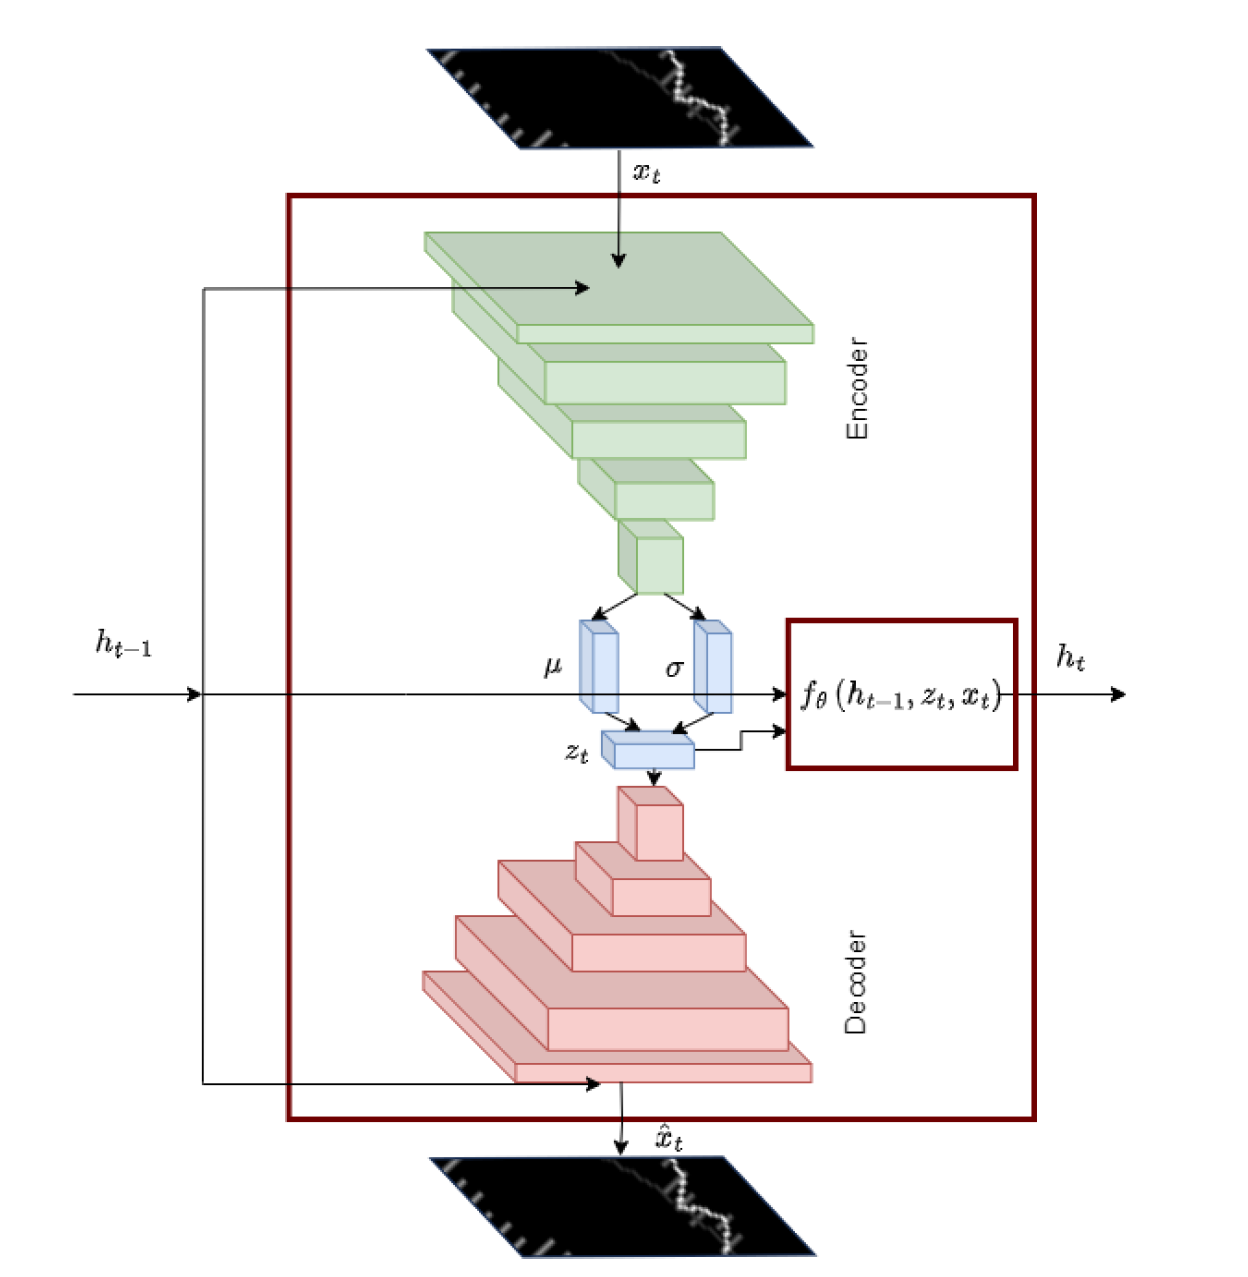
Let's delve into the above figure, which illustrates the architecture of a Variational Recurrent Neural Network (VRNN) cell. This figure is fundamental to understanding how the paper's proposed model operates to predict stock price movements through visual data.
Components of the VRNN Cell:
- Input Frame (xt): This represents the current market data input as a graphical frame. It's part of the sequential input that the model processes to predict future stock price movements.
- Prior Hidden State (ht-1): The hidden state from the previous timestep, carrying information processed up to that point. It serves as the memory component of the RNN, linking past information to current and future predictions.
- Latent Variable (zt): A crucial part of the Variational Autoencoder (VAE) within the VRNN, representing the compressed, essential features extracted from the input data. It's derived from the input frame and the prior hidden state, capturing the underlying stochastic nature of the stock market movements.
- Current Hidden State (ht): Updated hidden state, incorporating information from the current input frame, the previous hidden state, and the latent variable. It forms the basis for generating predictions and is passed on to the next timestep.
Operations within the VRNN Cell:
- Encoding: The input frame and the prior hidden state are processed to generate the latent variable, capturing the essential features and the uncertainty present in the input data.
- Decoding: Utilizing the latent variable and the prior hidden state, the model generates predictions for future market data. This process involves reconstructing or predicting the next frame based on the compressed information encoded in the latent variable.
- State Update: The hidden state is updated based on the current input, latent variable, and the previous hidden state. This step ensures that the model captures temporal dependencies and the sequential nature of the stock market data.
This architecture encapsulates the integration of RNN and VAE technologies to handle the complex task of predicting stock prices using graphical representations. The VRNN's architecture allows it to consider both the temporal sequence of market data and the inherent uncertainties, making it adept at forecasting future price movements. By compressing the input data into a latent space, the model can generate nuanced predictions that account for possible future scenarios, rather than a single deterministic outcome. This capability is crucial for adapting to the volatile nature of financial markets.
In summary, the above figure demonstrates how the VRNN model synthesizes information from past market dynamics and current data to predict future stock price movements, embodying the core innovation of the research paper.
Performance of Animated Stock Market Portfolio
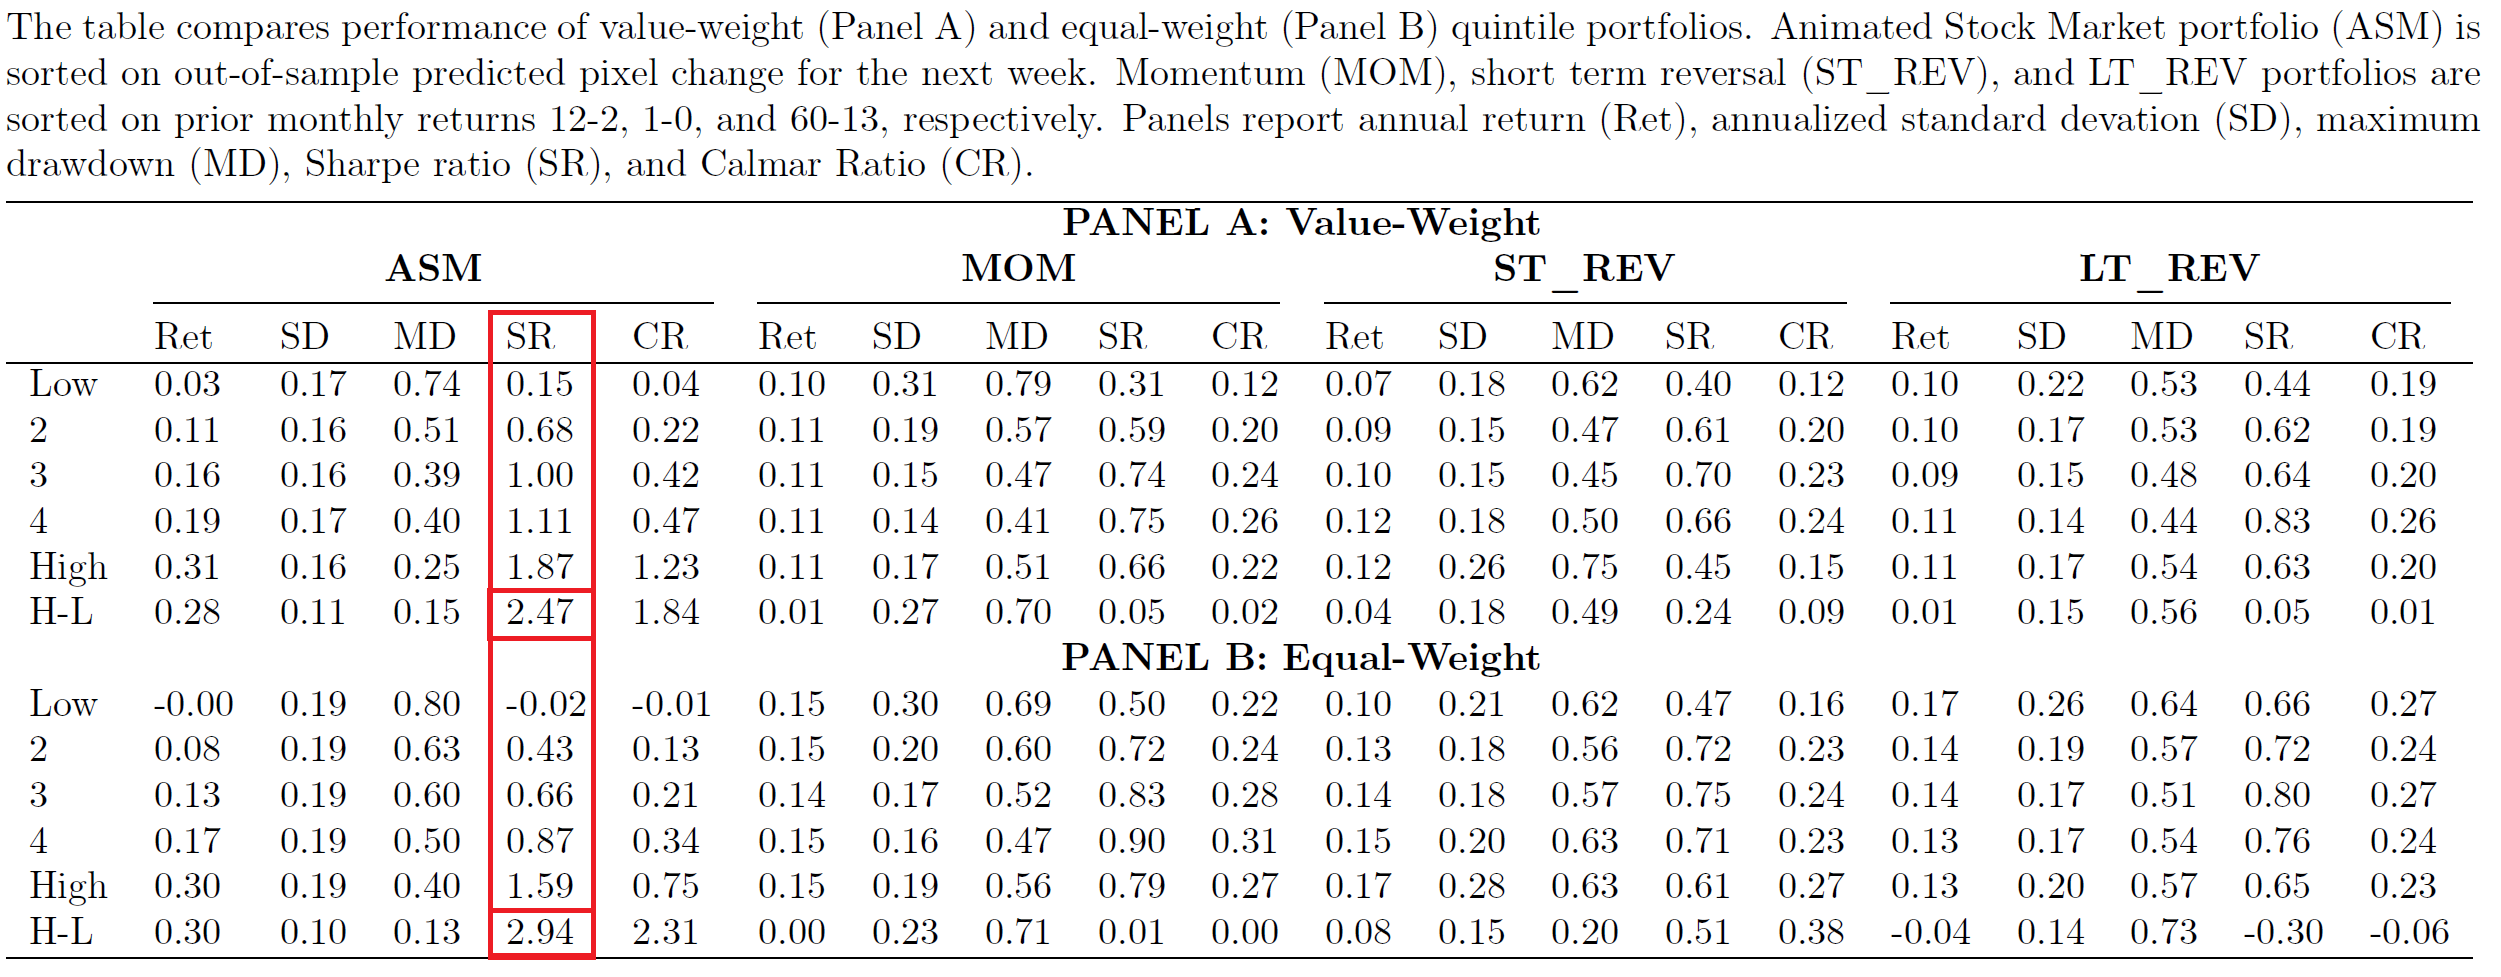
The above Table is critical as it directly compares the effectiveness of the VRNN model with other traditional trading strategies in portfolio management. It details the performance metrics for portfolios constructed using predictions from the VRNN model against those formed based on momentum, short-term reversal, and long-term reversal strategies. Metrics such as annual return, volatility (as indicated by annualized standard deviation), risk (through maximum drawdown), and efficiency (via Sharpe and Calmar ratios) are compared.
It is clear from the figure that the Animated Market Portfolio has a high Sharpe Ratio of 2.47 on a long-short portfolio that is higher than what can be achieved using other well-known strategies.
This comparison illustrates the VRNN model's superior predictive power and practical applicability, especially in constructing high-liquidity portfolios. By achieving higher Sharpe and Calmar ratios, the VRNN model not only promises better returns for a given level of risk but also suggests resilience during market downturns, which is invaluable for portfolio management and investment strategy formulation.
See our summary video:
Read the full article here:
Kaczmarek, Tomasz, and Kuntara Pukthuanthong. "Animating Stock Markets." (2023).